Understanding METR: What the Graph Actually Measures?
METR is a nonprofit research institute based in Berkeley, California, founded in December 2023 as a spinoff from the Alignment Research Center. The organization conducts independent evaluations of frontier AI models—the most advanced systems from companies like Anthropic (Claude), OpenAI (GPT series), and Google DeepMind—focusing on their capabilities to autonomously complete complex, long-horizon tasks.
AI EXPLAINER
Kenneth Lam
2/26/20265 min read
METR stands for Model Evaluation and Threat Research. It's a nonprofit research institute based in Berkeley, California, founded in December 2023 as a spinoff from the Alignment Research Center. The organization conducts independent evaluations of frontier AI models—the most advanced systems from companies like Anthropic (Claude), OpenAI (GPT series), and Google DeepMind—focusing on their capabilities to autonomously complete complex, long-horizon tasks.
The "Threat Research" component evaluates potential safety risks and concerning AI behaviors alongside capability advancement. This includes assessing whether advanced AI systems might pose risks like autonomous self-improvement, the ability to replicate themselves without oversight, or potential for sabotage of AI development systems.
METR is funded through donations and grants, including substantial support from The Audacious Project housed at TED. Importantly, while METR partners with AI companies to conduct pre-deployment evaluations, the organization emphasizes its independence and conducts some evaluations without involvement from model developers.
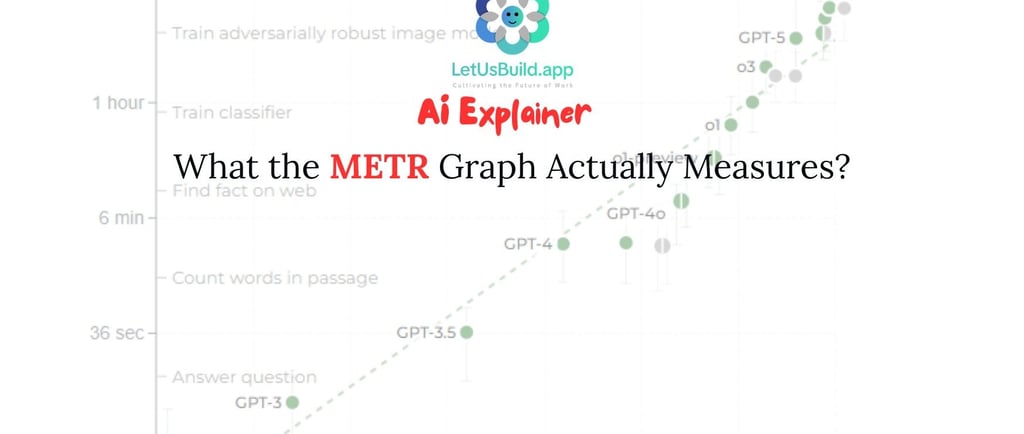
What Does the Graph Measure?
The METR graph doesn't measure AI capability broadly. It measures something specific: the length of software development tasks that AI agents can independently complete.
Here's the methodology:
Task Selection: METR creates a suite of software engineering tasks of varying difficulty. Difficulty is measured by how long it takes experienced human developers to complete the same tasks.
Task Duration Ranges: Tasks range from minutes to weeks. For example, a 1-hour task might be "write a function that does X," while an 8-hour task might be "refactor this codebase" or "debug this system," and a 1-week task might be "build this feature from specification."
Model Testing: METR runs AI models against these tasks and records whether the model can complete them successfully.
Time Horizon Calculation: METR then determines the "time horizon"—the length of task (in human expert time) at which an AI model can succeed with 50% reliability. This is the data point plotted on the graph.
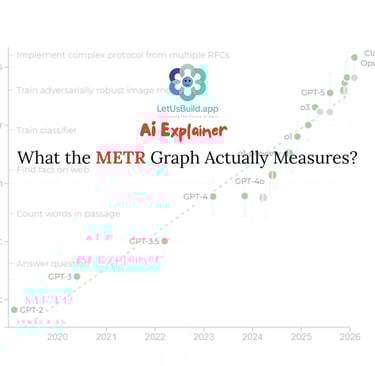
Historical Trend: By testing successive model releases over six years (2019-2025), METR identified a consistent pattern: the time horizon approximately doubles every seven months.
What's Important to Know About This Metric
It's Narrowly Focused
The METR graph measures only software engineering tasks. It doesn't measure AI's ability to do customer service, write marketing copy, manage projects, make strategic decisions, or thousands of other work tasks. It's a deep dive into one capability, not a broad measure of AI's overall impact on work.
The Error Bars Are Huge
METR explicitly publishes uncertainty ranges around its estimates. For Claude Opus 4.6, for example, the model might be able to reliably complete tasks taking humans anywhere from 2 hours to 20 hours—a massive range. This uncertainty matters because it affects timeline predictions. A model that appears capable of handling 5-hour tasks in the point estimate might only reliably handle 2-hour tasks in practice.
Recent Methodology Updates Complicate the Picture
In March 2025, METR published its original Time Horizon analysis covering data from 2019-2024, documenting the 7-month doubling pattern. In January 2026, METR released Time Horizon 1.1, an updated version of its measurement methodology applied to more recent models. The new version:
Expanded the task suite by 34% (adding 58 new tasks)
Doubled the number of long-duration tasks (8+ hours)
Changed the evaluation infrastructure
The updated data shows similar trends to the original analysis, but highlights how methodological choices affect the measurements. The post-2023 doubling time appears to be around 4.3 months (faster than the historical 7-month rate), but METR notes this could partly reflect the new measurement approach rather than pure capability acceleration.
What It Doesn't Measure
The METR graph does not measure:
Whether AI actually makes developers more productive in real-world settings: Research shows that developers often take 19 percent longer on tasks when using AI tools. This gap between capability advancement and actual productivity is critical to understanding real workplace impact.
Whether AI-generated code is higher quality than human-written code: Speed of task completion doesn't equal quality of output.
How long integration, review, and testing take: Much real work happens in coordination and validation, not initial code generation. The graph doesn't capture this.
Whether organizations can actually capture value from these capabilities: The commentary explores this gap directly—organizations face challenges translating capability into sustainable business value.
Human factors like cognitive load, context-switching cost, or burnout: The graph measures task speed but not the human cost of constant tool-assisted work acceleration.
Why Did METR Become So Central to AI Discussion?
Before METR's work, AI capability forecasting relied mainly on computing trends (how much compute is being used, how fast it's growing) or benchmark performance (how well models score on standardized tests). These metrics have limitations.
METR's approach is different. It creates a continuous metric that tracks progress across vastly different capability levels—from models that can barely handle minute-long tasks to models that approach hour-long or multi-hour tasks. This allows for:
Comparisons across time: You can see how each successive model compares to predecessors
Extrapolation: You can estimate when models might reach particular capability thresholds
Real-world relevance: Task completion is closer to actual work than abstract benchmark scores
The graph went from technical research to mainstream cultural artifact because it offers a simple visual narrative: exponential progress, seemingly predictable, measurable. As MIT Technology Review notes, in an era of AI hype, a graph that appears to quantify progress proved irresistible.
The Recent Data: What's Actually Happening?
The Sky News article (February 25, 2026) highlighted the release of Claude Opus 4.6, which appears to exceed even the accelerating trend predictions. This, combined with METR's updated Time Horizon analysis, raised questions about whether AI capability advancement is actually speeding up.
Three things are happening simultaneously:
Claude Opus 4.6 exceeded previous trend predictions: The latest Anthropic model appears more capable than historical trends would suggest, though METR's confidence intervals remain wide.
Post-2023 data shows faster apparent doubling: METR's Time Horizon 1.1 analysis suggests the post-2023 doubling time might be around 4.3 months, compared to the historical 7-month trend observed from 2019-2023.
Uncertainty about methodology: METR's infrastructure changes and expanded task suite make it harder to isolate whether the acceleration is real capability advancement or partly an artifact of measurement methodology changes.
The honest assessment: it's likely a mix of both. Genuine capability advancement appears to be happening. But without extended time observing data under the new methodology, we can't be certain about the magnitude of actual acceleration versus methodological effects.
Key Takeaways
The METR graph is real, valuable, and limited. It shows something important about one dimension of AI progress: the ability to handle longer, more complex software tasks autonomously. It does not show:
Whether that translates to human productivity gains (early evidence suggests it doesn't)
Whether organizations are prepared to deploy these capabilities
How humans experience working alongside increasingly capable systems
Whether the value exceeds the coordination and review costs
The graph is best understood as: One carefully measured dimension of AI capability, with real data and real limitations, that tells us something important about where technology is going—but not everything we need to know about what happens when it gets there.
For Further Reading
MIT Technology Review: "This is the most misunderstood graph in AI" (Feb 5, 2026)
METR's developer productivity study: Shows experienced developers take 19% longer on tasks while using AI tools
Sky News: "AI is developing so fast it is becoming hard to measure, experts say" (Feb 25, 2026)
Cultivating the Future of Work
Empowering businesses through human-centered AI.
© 2025. All rights reserved.